Choose a data onboarding path
The managed platform uses OpenTelemetry as the standard observability data model.
For observability workloads:
- OpenTelemetry provides the common telemetry model for logs, metrics, and traces;
- Elastic Agent provides the standard collection and telemetry gateway layer;
- Fleet provides centralized management of Elastic Agents, policies, and integrations;
- Elasticsearch stores and analyzes the resulting telemetry;
- Kibana provides visualization, investigation, and observability workflows.
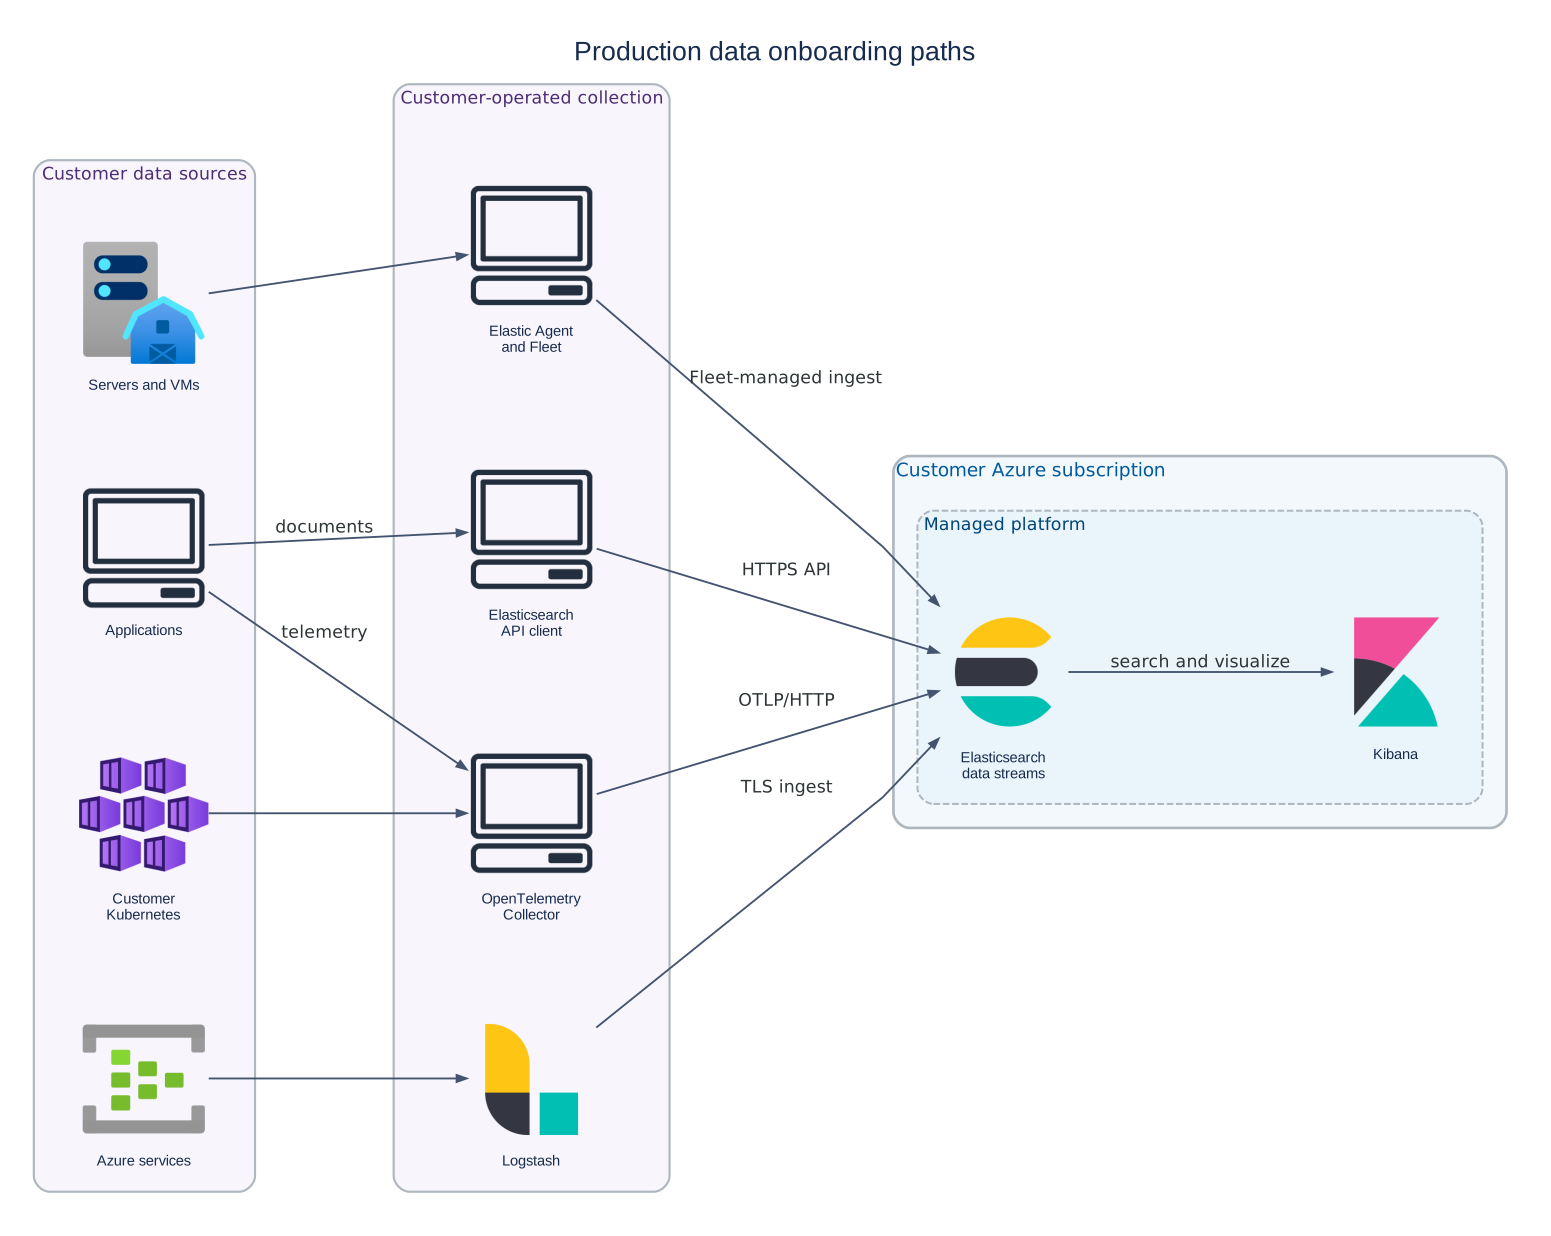
OpenTelemetry-first observability
For new observability workloads, prefer OpenTelemetry conventions and OpenTelemetry-native telemetry wherever supported.
The goal is to provide a consistent representation of telemetry from:
- applications;
- servers and virtual machines;
- Kubernetes;
- Azure services;
- databases and middleware;
- network and security systems;
- custom sources.
Elastic integrations that produce ECS-compatible events remain supported, but new observability designs should move toward OpenTelemetry semantic conventions and OTel-native data streams where available.
Choose by workload
| Data source | Recommended onboarding path |
|---|---|
| Application logs, metrics, and traces | Elastic Agent with OpenTelemetry integrations |
| Servers and virtual machines | Elastic Agent with OpenTelemetry integrations |
| Kubernetes | Elastic Agent with OpenTelemetry integrations |
| Azure services | Elastic Agent with OpenTelemetry integrations |
| Network and appliance telemetry | Elastic Agent integrations, normalized for the observability pipeline |
| Existing Logstash pipelines | Logstash where required for existing pipelines |
| Application search documents | Elasticsearch API |
| Existing Elasticsearch deployment | Migration or reindex process |
Observability data
For logs, metrics, and traces, use Elastic Agent with OpenTelemetry integrations as the preferred architecture.
Elastic Agent can collect or receive telemetry from applications, infrastructure, Kubernetes, Azure services, and supported integrations. Fleet centrally manages the agents and their policies.
The resulting observability data should follow OpenTelemetry conventions where supported.
See Manage Elastic Agents with Fleet, then continue with onboard observability data.
OpenTelemetry data streams
OpenTelemetry-native telemetry is stored using signal-specific data streams. Typical patterns include:
| Signal | Data stream pattern |
|---|---|
| Logs | logs-*.otel-* |
| Metrics | metrics-*.otel-* |
| Traces | traces-*.otel-* |
ECS-compatible streams can continue to exist for integrations and existing workloads that require them.
Search and application data
Application search data is different from observability telemetry.
Search documents, knowledge content, vector data, and application records are typically sent directly to Elasticsearch using the Elasticsearch API. These documents do not need to be represented as OpenTelemetry telemetry.
Continue with onboard search data.
Existing pipelines
Existing Logstash and ECS-based pipelines can continue to operate when required.
For new observability onboarding, prefer the OpenTelemetry-first architecture unless there is a specific compatibility requirement.
Use the deployment endpoints
Use only the Elasticsearch, Fleet, and other endpoints provided for your deployment.
The source system must be able to:
- resolve the endpoint hostname;
- reach the endpoint over the configured network path;
- trust the TLS certificate;
- authenticate using an approved credential.
Do not use administrator credentials for normal data ingestion.
Start small
Before onboarding the full production workload:
- configure one representative source;
- verify that Elastic Agent is receiving or collecting the telemetry;
- confirm logs, metrics, or traces are represented correctly;
- verify the expected OpenTelemetry attributes and resource metadata;
- confirm the data appears in the expected Elasticsearch data streams;
- validate the data in Kibana;
- then expand onboarding to additional sources.
Need help choosing?
Use:
- AI chat:
https://copilot.ivedha.cloud - Support portal:
https://support.ivedha.com/
For the next step, choose either: